Sales Funnel Optimization: A 2026 Practitioner’s Guide
Sales funnel optimization is the continuous process of identifying and fixing the conversion gaps between each stage of your buyer journey to increase revenue without proportionally increasing spend. It is not a one-time project. It is a cross-functional discipline that marketing, sales, and customer success run together on a repeating cadence.
Where to start in the next 24–72 hours:
- Measure first. Pull stage-by-stage conversion rates from your CRM or analytics platform. You cannot prioritize what you have not quantified.
- Prioritize the biggest leak. Find the one stage where the largest percentage of prospects drops off and focus your first experiment there.
- Run one focused test. Change a single variable, set a sample size before you start, and let it run long enough to reach statistical significance.
Key Takeaways
Sales funnel optimization is a continuous, cross-functional discipline: measure stage conversion rates, prioritize the biggest leak, run one focused experiment at a time, and repeat on a monthly or quarterly cadence.
| Point | Details |
|---|---|
| Measure before you fix | Calculate stage-by-stage conversion rates in GA4 and your CRM before running any experiment. |
| Prioritize the biggest leak | Use an impact × effort × confidence matrix to rank fixes; the highest-scoring item gets your first experiment. |
| Run disciplined experiments | Set sample size and minimum duration before launch; never call a test early due to weekly B2B traffic seasonality. |
| Align marketing and sales | A shared weekly funnel review with both teams looking at the same dashboard resolves most alignment failures faster than process redesign. |
| Clareefai for verified proof | Deploy verified testimonials and video reviews at the Consideration and Evaluation stages to unblock stalled deals and improve close rates. |
Table of Contents
- What is sales funnel optimization and why does it matter now?
- How do the six funnel stages map to buyer intent?
- How do you build a repeatable optimization process?
- What stage-specific tactics and A/B tests actually move conversion?
- What metrics and formulas should you track and report?
- Which tools should you use to measure and optimize your funnel?
- What mistakes do teams make most often, and how do you fix them?
- Why continuous optimization beats one-off campaigns every time
- Verified customer proof is a conversion lever, not a marketing decoration
- Sources
What is sales funnel optimization and why does it matter now?
Sales funnel optimization is the practice of systematically improving how prospects move through each stage of your buyer journey, from first awareness to closed deal and beyond. The goal is to raise the percentage of people who advance from one stage to the next, compounding those gains across the entire funnel.
The distinction between a funnel and a pipeline matters here. A pipeline is seller-centric: it tracks where your reps are in the deal process, what activities they have completed, and what revenue is forecast. A funnel is buyer-centric: it tracks where prospects are in their decision-making journey, what they understand, what they still doubt, and what they need next to move forward. Optimizing the funnel means thinking like your buyer, not your rep.
Funnel vs. pipeline at a glance:
- Funnel: tracks buyer mindset, intent signals, and content consumption
- Pipeline: tracks seller activities, deal stages, and forecast probability
- Funnel optimization asks “Why did they stop?” Pipeline management asks “What did we do next?”
- Funnel data lives in analytics and marketing automation; pipeline data lives in the CRM
The business case for disciplined optimization is straightforward. Small percentage-point gains at each stage multiply across the whole funnel. HubSpot’s sales optimization guidance makes the point directly: cross-functional alignment between marketing and sales is not a nice organizational goal, it is the operational prerequisite for sustained funnel gains. Teams that treat optimization as a shared RevOps discipline, rather than a marketing-only or sales-only task, consistently outperform those that work in silos.
The predictability benefit is equally important. When you measure conversion rates at every stage, you can forecast revenue with far more confidence. You know how many leads you need at the top to hit a quota at the bottom, and you know which stage to fix when the number falls short.
How do the six funnel stages map to buyer intent?
Most B2B funnels operate across six stages. Each stage reflects a distinct buyer mindset, and each transition requires a specific conversion event that you can track in your analytics platform or CRM. Understanding these stages in detail is the foundation for any optimization work.
| Stage | Buyer mindset | Sample conversion event |
|---|---|---|
| Awareness | “I have a problem or a goal I need to address.” | First website visit, ad click, or content view |
| Interest | “I want to learn more about this category or solution.” | Blog subscription, resource download, webinar registration |
| Consideration | “I am evaluating options and comparing vendors.” | Product page visit, case study download, demo request initiated |
| Intent / Evaluation | “I am ready to decide; I need proof and specifics.” | Demo attended, proposal requested, trial started |
| Purchase | “I am committing to this solution.” | Contract signed, payment processed, account created |
| Loyalty | “I want to get full value and may expand or refer.” | Renewal, upsell accepted, referral submitted, testimonial given |
Recording these events correctly is where most teams fall short. Each conversion event should be a named, discrete action logged in both your analytics platform (GA4 custom events, for example) and your CRM as a stage-change trigger. Vague stage names like “engaged” or “warm” are not trackable. Specific events like “demo_attended” or “proposal_sent” are.
Apollo’s research on B2B buyer behavior highlights a pattern that reshapes how you should think about the Consideration and Evaluation stages: a large share of B2B buyers prefer to self-educate before they ever speak to a rep. That means your funnel must support self-serve experiences, on-demand case studies, interactive product tours, and comparison content, not just gated forms that force a conversation before the buyer is ready.
Practical guidance for naming and recording stage events:
- Use verb-noun naming conventions: “demo_requested,” “trial_started,” “proposal_viewed”
- Set up GA4 custom events or HubSpot lifecycle stage triggers for each transition
- Align CRM stage names with funnel stage names so marketing and sales share the same vocabulary
- Review stage definitions with both teams quarterly; buyer behavior shifts and your stage map should reflect it
How do you build a repeatable optimization process?
Funnel optimization runs as a loop: measure each stage’s conversion rate, identify the biggest constraint, run a focused experiment, and repeat. The teams that move the needle fastest are the ones that institutionalize this loop rather than running it ad hoc.
Here is a step-by-step checklist you can assign to a RevOps owner this quarter:
- Map the full buyer journey. Document every touchpoint from first-touch channel to closed deal. Include content assets, emails, ads, sales calls, and follow-up sequences. Making the funnel visible is the prerequisite for finding leaks; small friction points compound into large revenue losses when left unaddressed.
- Instrument every stage transition. Confirm that each conversion event from the table above fires correctly in GA4 and your CRM. Audit for gaps: missing events, duplicate counts, and attribution errors are common.
- Calculate stage conversion rates. Use the formula: Stage conversion rate = (Prospects who reached Stage N+1) ÷ (Prospects who entered Stage N) × 100. Run this for every stage pair.
- Prioritize using an impact × effort × confidence matrix. Score each potential fix on three dimensions: how much revenue impact it could unlock (impact), how hard it is to implement (effort, inverted so that easy = high score), and how confident you are in the hypothesis (confidence). Multiply the three scores and rank. Fix the highest-scoring item first.
- Design and run one experiment per stage at a time. Write a hypothesis, define the primary metric, set a minimum sample size before launch, and agree on a minimum run duration. Never call a test early.
- Scale what works; kill what does not. Winners get rolled out to 100% of traffic. Losers get documented so the team does not repeat them. Both outcomes are valuable.
- Re-run the loop on a monthly or quarterly cadence. Similarweb recommends quarterly ICP refinement as a standard part of 2026-era optimization, since the buyers who convert best today may differ from those who converted best six months ago.
30/60/90-day timeline expectations:
- 30 days: Instrumentation complete, baseline conversion rates documented, first experiment live
- 60 days: First experiment concluded, one or two quick wins implemented, prioritization backlog built
- 90 days: Second experiment cycle underway, cross-functional playbook drafted, dashboard live for both marketing and sales
Pro Tip: Before you score fixes on the impact × effort × confidence matrix, get both your marketing lead and your sales lead in the same room to score independently, then compare. Disagreements reveal assumptions worth testing.
What stage-specific tactics and A/B tests actually move conversion?
The highest-leverage experiments vary by funnel stage. Generic “test your CTA button color” advice rarely moves the needle. Stage-specific hypotheses, grounded in what buyers actually need at that moment, do.
Awareness (top of funnel)
- Test headline framing: problem-led (“Still losing deals at demo?”) vs. outcome-led (“Close 30% more enterprise deals”)
- Run paid channel experiments: same offer, different audience segments defined by ICP firmographics
- Test content format: long-form guide vs. short video vs. interactive tool for the same topic
- Combining SEO and funnel campaigns at the top of funnel can improve lead quality before prospects even reach your site
Interest (mid-funnel content engagement)
- Test gated vs. ungated resources: ungated often increases volume; gated filters intent
- Experiment with email subject lines and send timing for nurture sequences
- Test content personalization by industry vertical or company size
Consideration (evaluation content)
- Place verified customer testimonials and case studies directly on product and comparison pages; test with and without social proof to measure lift
- Test demo request form length: fewer fields typically increase submission rate
- Experiment with live chat vs. chatbot vs. no chat on high-intent pages
Intent / Evaluation
- Test follow-up speed after a demo request: KlientBoost’s CRO research identifies follow-up timing as one of the highest-leverage variables for conversion lift
- Run A/B tests on proposal format: one-pager vs. detailed deck vs. interactive proposal
- Add peer reference calls or video testimonials to the evaluation package and measure impact on close rate
Purchase
- Simplify the contract or checkout flow; remove any step that does not add buyer confidence
- Test payment terms or trial-to-paid conversion sequences
Loyalty
- Test onboarding email cadence and milestone triggers
- Experiment with expansion offer timing relative to product usage milestones
One-page experiment template:
- Hypothesis: “Changing [X] for [audience segment] will increase [metric] because [reason].”
- Primary metric: One conversion event (e.g., demo_requested)
- Secondary metric: One guardrail metric (e.g., bounce rate)
- Minimum sample size: Calculate before launch using a power calculator (aim for 80% statistical power)
- Minimum duration: Two full business weeks at minimum; four weeks for low-traffic pages
- Segmentation rules: Define which traffic segments are included and excluded before the test starts
Pro Tip: Never run a test for fewer than two full weeks, even if you hit your sample size faster. Weekly seasonality in B2B traffic (Monday spikes, Friday drops) will skew results if you cut the test short.
For effective lead nurturing between the Interest and Consideration stages, sequence design matters as much as content quality. Test the number of touches, the gap between them, and the channel mix (email, LinkedIn, retargeting) before assuming your current cadence is optimal.
What metrics and formulas should you track and report?
The core formula for any stage is straightforward:
Stage conversion rate = (Prospects entering Stage N+1) ÷ (Prospects entering Stage N) × 100
Track this number weekly, not just monthly, so you catch drops before they compound.
Beyond stage rates, a complete funnel dashboard should surface five metric categories:
Top-line funnel conversion: The end-to-end rate from first touch to closed deal. This is your headline number for leadership reporting.
Stage-by-stage rates: Each individual transition rate. This is where you find the leak.
Funnel velocity: Average time a prospect spends in each stage. A stage where velocity is slowing often signals a friction point or a messaging gap, not a volume problem.
Source attribution: Conversion rates broken down by traffic source or campaign. High-volume sources with low conversion rates are expensive; low-volume sources with high conversion rates deserve more budget.
Experiment results log: A running record of every test, its hypothesis, result, and whether the change was rolled out. This prevents teams from re-testing the same losing ideas.
Stat to know: According to Capstone Design Group’s 11-step checklist, diagnosing leaks and fixing the highest-impact items first is the approach that produces measurable improvement fastest, particularly for teams that have not yet instrumented every stage.
Experiment reporting checklist:
- Did the test reach the pre-set minimum sample size?
- Did it run for the minimum pre-set duration?
- Is the result statistically significant at your chosen confidence level (typically 95%)?
- Did any external events (seasonality, product launch, outage) contaminate the test window?
- What is the projected annualized revenue impact if the winner is rolled out?
Benchmarking caveat: Industry conversion rate benchmarks vary widely by sector, deal size, and traffic source. A SaaS company selling a $50/month product will see fundamentally different stage rates than one selling a $50,000 annual contract. Use your own historical baseline as the primary benchmark, and treat published industry averages as directional context only.
For role-specific dashboard design in B2B sales, the principle is the same: give each stakeholder the two or three metrics that drive their decisions, not a wall of numbers.
Which tools should you use to measure and optimize your funnel?
No single platform covers every job. A practical funnel tech stack combines four to five tool categories, each doing a specific job well.
Tool categories and what each must deliver:
- Analytics: Tracks traffic, behavior, and conversion events across the funnel. Must support custom event tracking and multi-touch attribution.
- CRO and heatmaps: Visualizes where users hesitate, click, or abandon. Must support session replay and click maps.
- A/B testing and personalization: Runs controlled experiments and serves variant experiences. Must support statistical significance reporting and audience segmentation.
- CRM: Manages pipeline, records stage transitions, and connects marketing data to sales activity. Must integrate with your marketing automation platform.
- Testimonial and social-proof management: Collects, verifies, and publishes customer proof at the right funnel stage. Must support video testimonials, verified identities, and CRM integration.
| Tool | Primary use | Best for / funnel stage | Integration notes | Experimentation features | Reporting and attribution |
|---|---|---|---|---|---|
| Google Analytics / GA4 | Analytics and attribution | All stages; traffic and event tracking | Connects to most CRMs and ad platforms via data connectors | Supports A/B test data import; native explore reports | Multi-touch attribution; custom conversion events |
| HubSpot | CRM and marketing automation | Interest through Loyalty; lead nurturing and pipeline | Native integration with GA4, Salesforce, and most ad platforms | Workflow A/B testing for emails; landing page variants | Full-funnel attribution; lifecycle stage reporting |
| Salesforce | CRM and revenue operations | Intent through Loyalty; deal management and forecasting | Integrates with HubSpot, Marketo, and most analytics tools | Einstein analytics for predictive scoring | Opportunity attribution; revenue forecasting |
| Unbounce | Landing page building and CRO | Awareness and Interest; top-of-funnel conversion | Connects to HubSpot, Salesforce, and email platforms | Built-in A/B and multivariate testing; Smart Traffic AI | Conversion rate by variant; traffic source breakdown |
| Optimizely | A/B testing and personalization | Consideration and Evaluation; mid-funnel experiments | API-first; integrates with most analytics and CRM stacks | Full-featured experimentation platform; feature flags | Statistical significance reporting; segment-level results |
| Hotjar | Heatmaps and session replay | All stages; UX friction diagnosis | Embeds on any site; connects to GA4 and HubSpot | No native A/B testing; pairs with Optimizely or Unbounce | Heatmaps, scroll maps, session recordings, feedback polls |
| Clareefai | Testimonial and social-proof management | Consideration, Evaluation, and Loyalty; trust-building | CRM and review platform integrations; GDPR-compliant | AI-driven promoter identification; testimonial variant testing | Advocacy analytics; proof asset performance dashboards |
Microsoft Clarity is worth noting as a free alternative to Hotjar for session replay and heatmaps, particularly for teams with limited budgets. It provides click maps, scroll depth, and session recordings without a usage cap.
Vendor evaluation checklist:
- Does it sync data bidirectionally with your CRM?
- Does it support the attribution model your team uses (first-touch, last-touch, or multi-touch)?
- Can it run experiments without requiring engineering resources for every test?
- Does it meet your privacy and compliance requirements (SOC 2, GDPR, CCPA)?
- How long does implementation take, and what does onboarding support look like?
What mistakes do teams make most often, and how do you fix them?
The most common funnel problems are not technical. They are organizational and strategic, and they show up in the data in predictable ways.
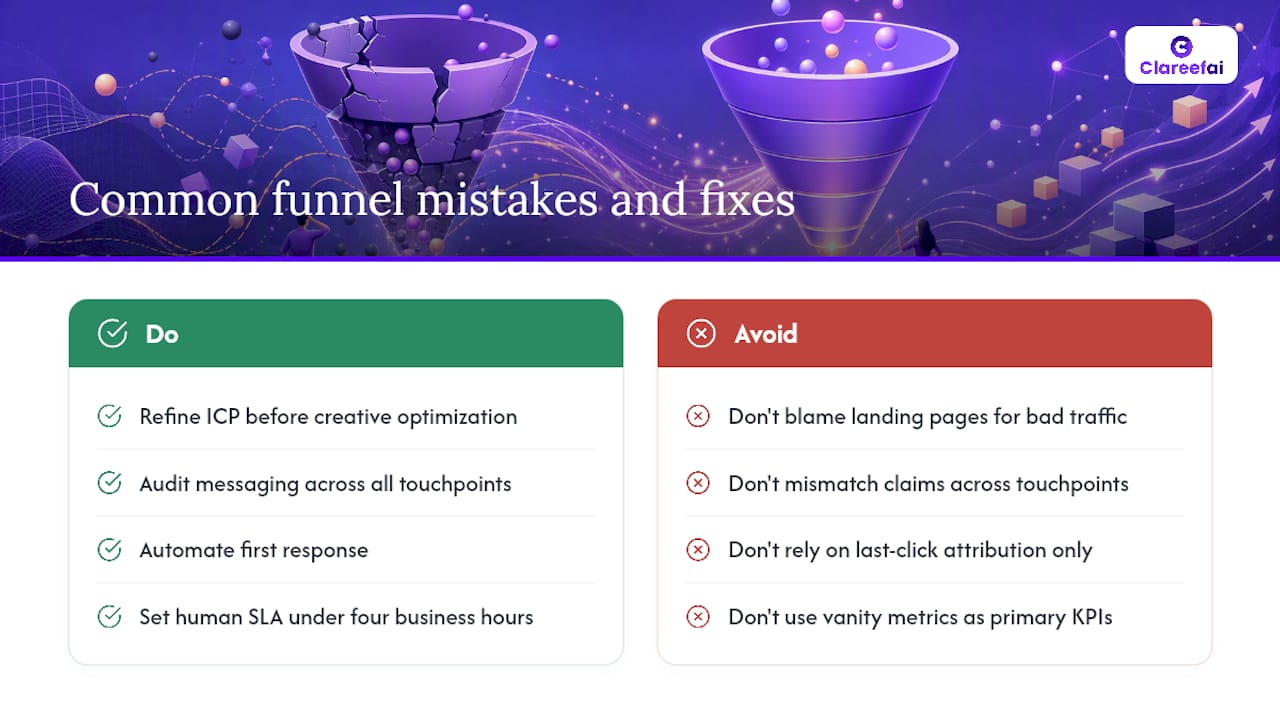
Bad traffic at the top. When your Awareness-to-Interest conversion rate is low, the instinct is to fix the landing page. Often the real problem is that the traffic itself is poorly targeted. Ads reaching the wrong firmographic profile, or SEO content attracting researchers rather than buyers, will produce low conversion rates no matter how good the page is. The fix is ICP refinement before creative optimization. Similarweb’s 2026 tactics make this point directly: industry-specific, ICP-driven experiments outperform generic playbooks.
Inconsistent messaging across stages. A prospect who clicks an ad promising “enterprise-grade security” and lands on a page that leads with “easy setup for small teams” experiences a trust break. That break shows up as a high bounce rate and a low form-submission rate. Audit your messaging from ad copy through proposal, and confirm the value proposition is consistent at every touchpoint.
Slow lead response. Speed-to-lead is one of the most studied variables in B2B conversion. A prospect who submits a demo request and hears nothing for 48 hours has often moved on or started a competitor evaluation. Automate the first response, even if it is just a calendar link, and set a human follow-up SLA of under four business hours for high-intent leads.
Poor instrumentation. You cannot prioritize what you cannot measure. Teams that rely on last-click attribution in GA4 without custom event tracking are flying blind on mid-funnel behavior. Before running any experiment, audit your event tracking and confirm that every stage transition fires correctly.
Siloed teams. Marketing optimizes for lead volume; sales optimizes for close rate; neither team sees the full picture. HubSpot’s sales optimization framework treats cross-functional alignment as the foundation of the discipline. A weekly 30-minute funnel review with both marketing and sales present, looking at the same dashboard, resolves most alignment failures faster than any process redesign.
Integrating qualitative data. Quantitative data tells you where prospects drop off. It does not tell you why. Add qualitative inputs: exit surveys on high-drop pages (Hotjar polls work well here), recorded demo calls reviewed for objection patterns, and customer interviews with both buyers who converted and buyers who did not. Session replays often reveal friction that no one on the team anticipated, a form field that confuses users, a CTA that is below the fold on mobile, a pricing page that raises more questions than it answers.
Pro Tip: Avoid vanity metrics like total page views or email open rates as your primary funnel KPIs. Track conversion events that represent real buyer intent: demo_requested, trial_started, proposal_viewed. Open rates tell you about subject lines; they tell you nothing about pipeline.
For social selling tactics that complement funnel optimization, the same principle applies: measure the actions that indicate genuine buyer intent, not activity volume.
Why continuous optimization beats one-off campaigns every time
The conventional wisdom in many marketing teams is that funnel work happens in sprints: you run a campaign, you look at results, you move on. That model produces diminishing returns because it treats the funnel as a static structure rather than a living system that reflects buyer behavior, competitive dynamics, and market conditions.
The teams that consistently improve conversion rates are the ones that treat optimization as a permanent operating rhythm. They run experiments in parallel across multiple stages. They hold monthly funnel reviews where marketing and sales look at the same data. They document every test, win or loss, so institutional knowledge accumulates rather than evaporating when someone leaves.
One pattern worth highlighting: small wins compound in ways that are easy to underestimate. Over a year of monthly experiments, the cumulative effect of small, disciplined wins routinely outperforms a single large campaign.
The cultural dimension matters too. When marketing and sales share a funnel dashboard and review it together weekly, they stop arguing about lead quality and start diagnosing the system together. That shift, from blame to shared diagnosis, is often the single biggest unlock for a team that has been stuck at the same conversion rates for quarters.
Verified customer proof is a conversion lever, not a marketing decoration
Prospects at the Consideration and Evaluation stages are not asking whether your product works. They are asking whether it works for companies like theirs. Generic five-star ratings do not answer that question. Verified, contextualized testimonials from named customers in the same industry, role, or use case do.
Clareefai is built specifically for this problem. The platform collects, verifies, and publishes customer testimonials, video reviews, and reference stories across the channels where your prospects are evaluating you: landing pages, demo follow-up emails, proposal decks, and review sites. Its AI-driven promoter identification surfaces the customers most likely to influence a specific prospect, so your sales team can deploy the right proof at the right stage rather than sending the same generic case study to everyone.
Mapped to funnel stages, Clareefai supports:
- Consideration: Verified testimonials and video proof on product and comparison pages, reducing hesitation before a demo request
- Evaluation: Reference calls and peer testimonials delivered in the post-demo follow-up sequence, addressing the specific objections raised in the call
- Loyalty: Automated testimonial collection from satisfied customers, turning closed deals into advocacy assets for the next prospect
The for-sales solution page shows how sales teams use verified proof to accelerate decisions and improve win rates. You can also see how testimonial management improves win rates in practice. Start a trial or book a demo to see how Clareefai fits into your existing CRM and funnel stack.
Sources
The sources below each offer something specific. Use them in the order that matches your current priority.
- Sales optimization (HubSpot blog)
- 9 Sales Funnel Optimization Tactics for 2026 | Similarweb
- Sales Funnel Optimization: Complete Guide for 2026 (ClicksGeek)
- What Is Sales Funnel Optimization? (Apollo Insights)
- Funnel Optimization: Definition, How It Works & Best Practices | Outsales
Recommended
Share Article
Stay Updated
Get the latest insights on customer advocacy and SaaS growth delivered to your inbox.