Result First Case Study ROI B2B Teams (Defensible Math & Evidence)
A case study ROI is the return calculated from a documented technology or service deployment, following a consistent cost-and-benefit methodology so the resulting number holds up under scrutiny. This article leads with real results, from a 96% ROI at Steel Partners to a 629% ROI at Manitou Group, then walks through the formulas, attribution rules, and reporting habits that make those numbers defensible instead of decorative.
TL;DR:
- ROI figures should be supported by itemized costs, including both direct and indirect expenses, and clearly show the baseline and time horizon used.
- Using a 12-month ROI is suitable for quick projects, while multi-year calculations should employ net present value to account for benefit timing.
- Credible case studies present concrete operational metrics, such as hours saved or cycle time reduction, instead of relying solely on revenue figures or percentages.
- Establishing a consistent attribution method and measurement window before analysis is essential to produce defendable and transparent ROI results.
- Verified proof like customer testimonials, reference notes, and engagement data strengthens the credibility of ROI claims and aids sales discussions.
Table of Contents
- What a Case Study ROI Actually Measures
- Building an ROI Case Study: The SCSR Method and What to Track
- The ROI Formula, Payback Period, and a Worked Example
- What Real ROI Case Studies Look Like in Practice
- How to Make Your ROI Numbers Defensible Under Scrutiny
- Where ROI Claims Go Wrong
- How Clareefai Strengthens the Evidence Behind Your ROI Claims
- Using Case Studies in Sales Conversations
- Turn Verified Customer Proof Into Your Next Case Study
- Sources
- FAQ
What a Case Study ROI Actually Measures
A case study ROI documents actual results from a real deployment: what it cost, what changed, and how long it took to pay back. Nucleus Research defines these as thorough examinations that follow a consistent methodology and quantify both direct and indirect financial results. That consistency is the whole point. Without it, an ROI figure is just a number someone picked because it sounded good in a sales deck.
You should lead with the headline metric, not build up to it. Finance teams and procurement reviewers skim. Put the result in the first sentence or the subhead. Then earn it with the math.
This structure also separates a case study from a testimonial or a white paper, and the distinction matters for how you use each one:
- Testimonials capture sentiment. They tell a prospect “this customer is happy,” but rarely quantify why.
- White papers explain a concept or methodology. They build authority but don’t prove outcomes for a specific customer.
- Case studies connect a specific customer, a specific problem, and a specific measured result. They’re the only format built to answer “what will this actually do for my business?”
A persuasive ROI case study needs a few non-negotiable ingredients before you publish it:
- A named customer (or a clearly labeled anonymized one) with enough context to feel real
- A baseline number before the change, not just an after number
- A defined time horizon, stated plainly
- At least one cost figure, not just benefits
- A stated attribution method, even a simple one
Case studies remain one of the most common B2B content formats for a reason: 58% of B2B marketers reported using them in 2025, according to Content Marketing Institute data cited by Scale Growth Digital. That popularity means your case study is competing with a lot of noise. The ones that get cited, forwarded, and remembered are the ones that show their work.
Building an ROI Case Study: The SCSR Method and What to Track
The most reliable structure for an ROI case study follows four beats: Situation, Challenge, Solution, Results (SCSR). This isn’t just a writing template. It’s a data-collection discipline, because each section forces you to capture something specific before you ever start drafting.
The Situation section sets the baseline: company size, industry, and the state of the process before the change. The Challenge names the specific pain, ideally with a number attached (hours lost, deals stalled, churn rate). The Solution describes what was implemented and over what period. The Results section is where the ROI math lives, and it needs to show both percentage return and absolute dollar impact, because percent alone tends to obscure scale when a reader is trying to judge whether the outcome applies to a business their size.
Before you calculate anything, you need clean data in four buckets:
- Direct costs — software licenses, implementation fees, training time, and any one-time setup charges.
- Indirect costs — internal staff hours spent managing the rollout, opportunity cost of delayed other projects, and ongoing maintenance.
- Hard benefits — measurable revenue gained, costs avoided, or hours saved, converted to dollars using a documented hourly rate.
- Soft benefits — improvements like satisfaction or retention that matter but need a separate, clearly labeled estimate rather than being folded into the hard-benefit total.
Time horizon changes the story. A simple ROI calculation over 12 months tells a different story than a three-year net present value (NPV) model. Nucleus Research’s ADP Lyric HCM case study used a three-year window specifically because HR technology savings compound as retired legacy systems stop costing money and productivity gains accumulate. Use simple ROI for anything under 18 months. Switch to NPV once you’re modeling multi-year benefits, because a dollar saved in year three is worth less than a dollar saved today.
Pro Tip: Pull your baseline numbers before you announce the project internally. Once a team knows a change is coming, behavior shifts, and your “before” data gets contaminated with anticipatory improvement.
Trust signals separate a credible case study from a marketing claim. Show the raw before-and-after numbers, not just the calculated percentage. Note whether the analysis came from an internal team or an independent third party. Nucleus Research’s methodology page is a useful reference here, since it explains what a consistent, third-party-style ROI examination actually includes.
The ROI Formula, Payback Period, and a Worked Example
The basic formula is simple: ROI = (Net Benefit / Total Cost) × 100. Net benefit equals total benefit minus total cost. That’s simple ROI, and it works fine for single-year projects with clean numbers.
Two variants matter for more complex cases. Profit-based ROI substitutes gross profit for revenue in the benefit calculation, which matters enormously if you’re claiming revenue lift but ignoring the cost of goods sold tied to that revenue. NPV-based ROI discounts future-year benefits back to present value using a discount rate (often the company’s cost of capital), which is standard for any case study spanning more than a year.
Payback period answers a different question: how long until the investment breaks even? The formula is Total Cost / Monthly Net Benefit. A $50,000 implementation generating $10,000 in monthly net benefit pays back in five months. This number often matters more to a CFO than the eventual ROI percentage, because it answers “how long is my capital at risk?”
Here’s a worked example showing how a percentage lift becomes an attributable dollar figure:
- A sales team implements a testimonial and reference-call platform for $7,500 per year.
- Win rate on deals where prospects viewed verified testimonials rises from 22% to 27%, a five-point lift.
- The team closes 200 qualified opportunities per year at an average deal size of $18,000.
- Five points on 200 deals is 10 additional closed deals, worth $180,000 in new revenue.
- Applying a conservative 40% gross margin, attributable profit is $72,000.
- Net benefit: $72,000 minus $7,500 in cost = $64,500.
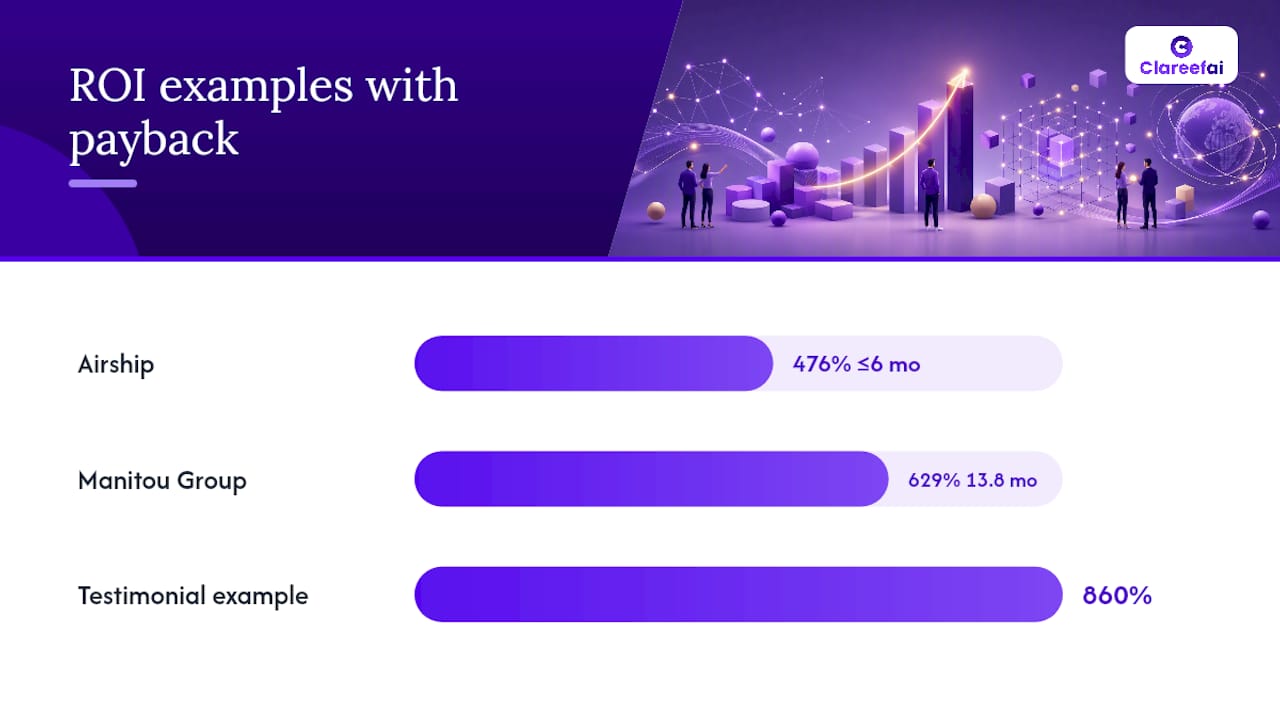
- ROI = ($64,500 / $7,500) × 100 = 860%.
That number looks dramatic, and that’s exactly why you present a range instead of a single figure. Show a low estimate (maybe only half the win-rate lift is attributable to the platform, given other sales initiatives running simultaneously), a likely estimate, and a high estimate.
For context on what “good” looks like: Forrester’s Total Economic Impact study for Airship reported 476% ROI over three years with a payback period under six months, and Manitou Group’s workflow automation case reported 629% ROI with a 13.8-month payback. Triple-digit ROI is common in well-documented B2B software case studies, particularly when labor savings compound over multiple years.
What Real ROI Case Studies Look Like in Practice
Public ROI case studies vary widely in rigor, and comparing a few side by side shows what separates a defensible claim from a suspicious one.
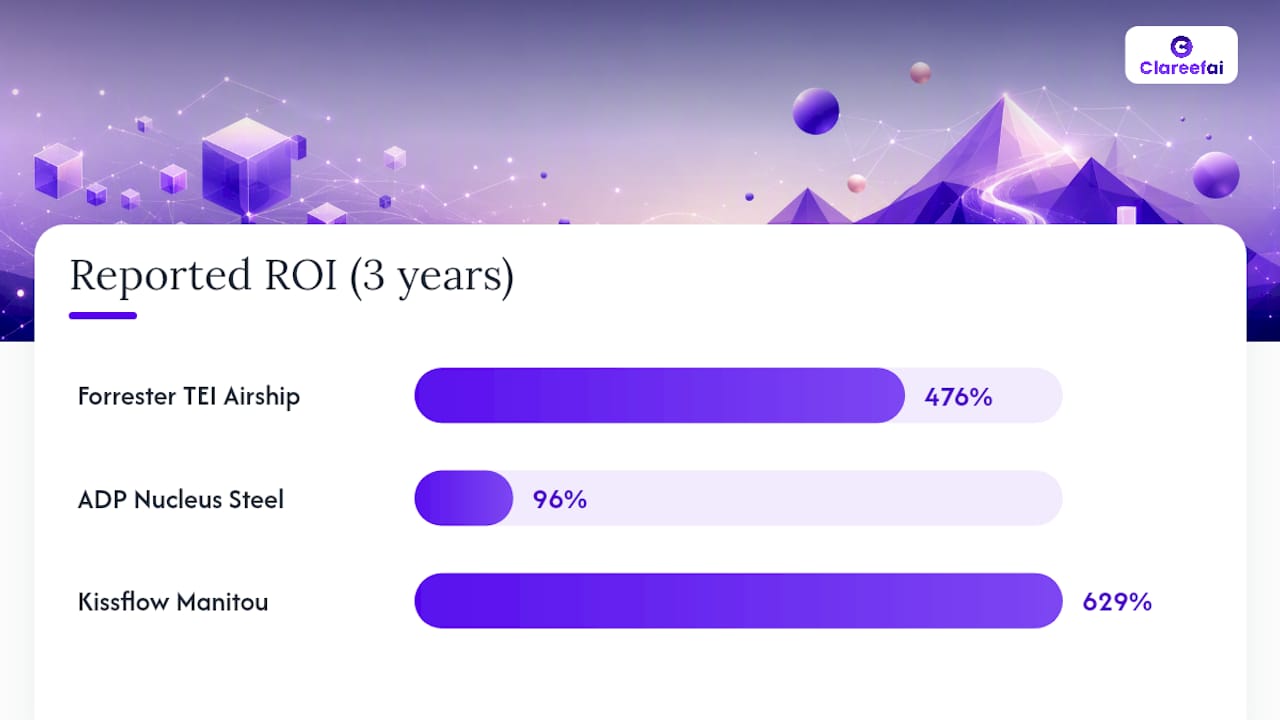
Airship’s Forrester-commissioned Total Economic Impact study modeled a composite organization built from multiple real customer interviews, reporting 476% ROI over three years, a payback period under six months, and an NPV of $6 million. The strength here is the composite methodology: Forrester interviews several actual customers and builds a conservative blended model rather than cherry-picking the single best-performing account. The caveat: composite models smooth out variance, so an individual company’s results could land well below the modeled average.
ADP’s Nucleus Research case study on Steel Partners itemized savings down to specific line items, including $1.2 million in retired legacy software costs, alongside HR productivity gains, to calculate a 96% ROI over three years. The lower percentage, compared to some vendor claims, is actually a credibility signal. It reflects real itemized cost accounting rather than a benefits-only calculation.
Kissflow’s case study at Manitou Group reported 629% ROI and a 13.8-month payback tied to concrete operational changes: faster onboarding, quicker invoice processing, and reduced manual hiring steps. The specificity of the operational metrics, rather than a single blended revenue number, is what makes this one checkable.
An AR maintenance-and-repair pilot study documented in an AREA industry report used a six-month pilot window specifically to model whether benefits would scale before a full rollout. This is a smart pattern for any team nervous about committing to a full-year case study before proving the concept works at all.
The lessons that carry across all four:
- The most credible studies show itemized costs, not just a benefits total.
- Multi-customer composite models (like Forrester’s TEI format) tend to earn more trust than single-anecdote claims.
- Operational metrics (hours saved, cycle time reduced) often persuade skeptical readers faster than a blended revenue number.
- A stated time horizon, even a short pilot window, beats an unstated one every time.
How to Make Your ROI Numbers Defensible Under Scrutiny
Procurement teams and finance reviewers have seen inflated ROI claims before, so the burden is on you to show your attribution logic, not just your result.
Design a holdout comparison when you can. If you’re rolling out a new tool to one sales team, keep a comparable team on the old process for the measurement window. The gap between the two groups is a far stronger ROI signal than comparing one team’s before-and-after, because it controls for seasonal demand shifts and general market conditions that would have affected performance either way.
Choose and write down your attribution rule before you start measuring, not after you see a number you like. For case studies distributed as video, Visionair Media’s attribution guide recommends direct attribution through tagged links or dedicated landing pages whenever possible, since it removes guesswork about whether a viewer actually converted because of the content.
Match your measurement window to the sales cycle, not to whatever timeframe makes the number look best. A 90-day window on a deal cycle that averages nine months will only capture a fraction of the pipeline influenced by your case study. Extend the window until it covers at least one full cycle.
Record baseline data before rollout and keep the raw numbers, not just the calculated percentage. A one-line disclaimer stating your assumptions (attribution percentage, margin used, discount rate) does more for your credibility than any amount of polished formatting.
- Set a baseline period and freeze the numbers before any change goes live.
- Define your attribution rule in writing and apply it consistently across every reported metric.
- Pick a measurement window that spans at least one full sales cycle.
- Publish the assumptions alongside the result, not buried in a footnote.
Pro Tip: If you can’t build a true holdout group, at least segment your results by customer size or deal complexity. A single blended average can hide the fact that your tool works brilliantly for enterprise deals and does almost nothing for small ones.
Where ROI Claims Go Wrong
The most common mistake is using revenue lift as the entire ROI story while ignoring the cost of goods, implementation labor, and ongoing maintenance that made that revenue possible. A case study claiming $500,000 in new revenue means very little without knowing the margin on that revenue and what it cost to generate it.
Short measurement windows are the second red flag. A 30-day case study on a product with a six-month sales cycle almost certainly captured a temporary spike, not a durable trend. Ask how long the data collection ran before you trust the percentage.
Cherry-picked customers are the third. If a vendor’s published case study features their single best account without disclosing how that customer compares to the average, treat the ROI figure as a ceiling, not a typical outcome.
A few practices keep your own reporting honest:
- State whether the featured customer is representative of your typical result or an outlier, explicitly.
- Include distribution and production costs (video editing, design, promotion) in the total cost figure, not just software fees.
- Disclose the attribution percentage you applied if the benefit wasn’t 100% directly traceable to your product.
- Use language like “based on customer-reported data over a 12-month period” rather than implying independent verification you don’t have.
Transparent disclosure isn’t a weakness in your case study. It’s the thing that lets a skeptical CFO actually believe the number in front of them.
How Clareefai Strengthens the Evidence Behind Your ROI Claims
Verified evidence is what separates a case study a prospect trusts from one they scroll past. Clareefai’s platform is built around capturing exactly the kind of documented, attributable proof that ROI reporting depends on, rather than relying on secondhand quotes or unverified praise.
Two examples from a customer base show what this looks like in practice. One manufacturing company used a platform to collect and verify testimonials tied to specific sales stages, giving its team traceable evidence to reference during procurement reviews. Another group used verified video testimonials and reference calls to shorten the trust-building phase of its sales cycle, giving prospects direct access to real customers rather than a written summary alone.
The evidence that strengthens an ROI claim tends to fall into a short list of categories, and Clareefai is built to capture all of them:
- Video view counts, showing which testimonials prospects actually engaged with.
- Reference call notes, documenting what a real customer said in their own words.
- Tagged attribution fields, connecting a specific testimonial to a specific deal stage or outcome.
- Verified identity data, confirming the customer behind a quote is real and current.
Feed this data into your ROI reporting template directly. A tagged attribution field showing which testimonial a prospect viewed before converting gives you a defensible attribution rule instead of a guess, which is precisely the gap most case studies leave unaddressed.
Using Case Studies in Sales Conversations
Deploy your best ROI case study at the evaluation stage, right when a prospect is comparing vendors and needs proof beyond your own claims. Earlier in the funnel, a lighter testimonial does the job. Save the full case study, with its baseline numbers and attribution notes, for the stakeholder who has to defend the purchase internally.
Build a one-page executive summary alongside the full version. Put the headline ROI, the payback period, and one sentence of methodology at the top. Executives rarely read past the first paragraph, and that paragraph needs to carry the whole argument.
For your sales team, a short pre-share checklist prevents misuse:
- Confirm the featured customer’s industry and size roughly match the prospect’s.
- Know the time horizon behind the ROI number cold, in case someone asks.
- Have the raw before-and-after figures ready if a buyer wants to see past the percentage.
The best case study in your library is worthless if the rep sharing it can’t answer a basic follow-up question about how the number was calculated.
— ClareefAi
Turn Verified Customer Proof Into Your Next Case Study
Clareefai gives sales and marketing teams a way to collect and verify the exact evidence a defensible ROI case study needs, instead of chasing down quotes manually after every deal closes. The platform’s AI-driven matching identifies which customers are strongest advocates, automates the request for testimonials and reference calls, and tags each piece of feedback so it’s ready to plug into an attribution model the moment you need it.
That structured evidence collection maps directly onto the checklist covered above: verified identity, tagged attribution, video engagement data, and reference call notes, all centralized instead of scattered across inboxes and spreadsheets. Teams focused on management-level reporting can see how this connects to broader advocacy ROI tracking, while marketers building content assets can review testimonial-driven strategies for their funnel.
If you’re building your next ROI case study and need the underlying proof to hold up under a finance team’s questions, start with a free plan or compare the Basic, Professional, and Enterprise plans to see which fits your team’s testimonial volume.
Sources
A few sources are worth returning to depending on what you’re building. Nucleus Research’s ROI case study library is the best reference for methodology and definitions. For a worked, high-magnitude example with full cost and NPV breakdowns, Forrester’s Total Economic Impact study for Airship shows commissioned-study rigor in action. If you need a writing template with recommended word counts and structure, Scale Growth Digital’s case study guide covers the SCSR format in detail. For teams weighing broader marketing technology costs against expected benefit, the marketing automation checklist from BabyLoveGrowth offers a useful parallel framework for cost planning.
- ROI Case Studies — Nucleus Research
- The Total Economic Impact™ of Airship: 476% ROI | Airship
- Nucleus Research ROI Case Study | ADP Lyric HCM at Steel Partners
- How to Write a Case Study (2026 Guide) — Scale Growth Digital
FAQ
Is a 20% ROI Good for a Case Study?
It depends heavily on the time horizon and industry, but 20% over a single year is generally modest compared to published B2B software case studies, which frequently report triple-digit ROI over multi-year periods. Always compare the percentage alongside its time horizon before judging it.
Is a 40% ROI Good?
Context matters more than the number alone: a 40% ROI on a low-risk, low-cost tool is a stronger result than the same percentage on a large capital investment with a multi-year commitment.
What Does a 10% ROI Mean?
It’s not necessarily a failure. Some infrastructure or compliance investments carry lower direct ROI but deliver value through risk reduction that a simple percentage doesn’t capture, which is why ROI works best alongside other success metrics rather than as the only number reported.
How Do You Calculate ROI for a Case Study?
Use the formula ROI = (Net Benefit / Total Cost) × 100, where net benefit is total quantified benefit minus total cost. For multi-year projects, apply an NPV discount rate to future benefits before running the calculation, and always pair the percentage with the payback period so readers understand both the scale and the speed of the return.
Can Clareefai Help Build the Evidence for an ROI Case Study?
Yes. Clareefai captures verified testimonials, reference call notes, and tagged attribution data that plug directly into ROI reporting, giving sales and marketing teams a documented trail instead of relying on unverified praise. Current pricing for the Basic, Professional, and Enterprise plans is listed on Clareefai’s site, alongside a free plan for teams getting started.
Recommended
Share Article
Stay Updated
Get the latest insights on customer advocacy and SaaS growth delivered to your inbox.