NPS vs CSAT: Which Metric Should You Actually Use?
Neither NPS nor CSAT wins outright, because they answer different questions. CSAT measures how a customer felt about one specific interaction. NPS measures how a customer feels about your entire relationship, and whether they’d risk their own reputation to recommend you. Pick the metric that matches the decision you’re trying to make, not the one that sounds more prestigious in a board deck.
Here’s the fast version:
- Use CSAT right after a support ticket closes, a purchase completes, or an onboarding step finishes. It tells you if that specific moment worked.
- Use NPS on a quarterly or milestone cadence to track loyalty trends and surface your best advocates.
- Your next step: map each customer touchpoint to a goal (fix a moment vs. measure loyalty), then instrument the right metric there instead of bolting both onto every survey.
The rest of this piece covers the math behind each score, a side by side comparison, survey design that actually gets responses, benchmarking traps, and a real example of what happens when you connect these scores to a testimonial and advocacy program.
Key Takeaways
CSAT and NPS measure different things entirely, and the right VoC program uses both, on different cadences, feeding a single advocacy pipeline.
| Point | Details |
|---|---|
| Match metric to moment | Use CSAT for specific interactions, NPS for overall relationship health. |
| Calculate NPS correctly | %Promoters (9 to 10) minus %Detractors (0 to 6), on a 0 to 10 scale. |
| Calculate CSAT correctly | Percentage of respondents rating 4 or 5 on a typical 1 to 5 scale. |
| Avoid survey fatigue | Separate CSAT triggers from periodic NPS pulses instead of asking both every time. |
| Convert promoters to assets | Route NPS promoters into testimonial and referral workflows automatically. |
Table of Contents
- NPS vs CSAT Definitions and How to Calculate Each One
- How Do NPS and CSAT Compare Across Key Dimensions?
- When Should You Use CSAT vs NPS in Practice?
- What Survey Design Actually Gets Usable Answers?
- How Do You Interpret Scores and Set Realistic Benchmarks?
- How One Company Turned Feedback Into Referrals
- Turn Your CX Scores Into Sales Assets
- What the Data Actually Tells Us About This Debate
- Sources
NPS vs CSAT Definitions and How to Calculate Each One
Net Promoter Score (NPS) asks a single relational question: “How likely are you to recommend [company] to a friend or colleague?” on a 0 to 10 scale. Respondents split into three groups: promoters (9 to 10), passives (7 to 8), and detractors (0 to 6). The formula is straightforward.
- Survey a batch of customers on the 0 to 10 scale.
- Calculate the percentage of promoters and the percentage of detractors.
- Subtract: NPS = %Promoters − %Detractors.
Say you survey 200 customers. 110 score 9 or 10 (55% promoters), 60 score 7 or 8 (passives, excluded from the math), and 30 score 0 to 6 (15% detractors). Your NPS is 55 minus 15, or +40. Scores run from −100 to +100, and Qualtrics’ breakdown of the promoter, passive, and detractor groupings is the standard reference most CX teams cite when setting up their first survey.
Customer Satisfaction Score (CSAT) asks about one specific interaction: “How satisfied were you with [this support call/purchase/onboarding session]?” typically on a 1 to 5 scale, sometimes 1 to 10. You calculate CSAT as the percentage of respondents who chose the top two boxes (4 or 5 on a 5-point scale), divided by total responses, times 100.
If a large portion of respondents rate their support interaction highly on the satisfaction scale, your CSAT reflects the percentage of satisfied customers. SurveyMonkey’s guidance on CSAT scaling notes that some teams use a 1 to 10 scale instead, which changes what counts as “satisfied” and makes cross-team comparisons tricky if your organization doesn’t standardize the scale first.
One nuance worth flagging: “transactional NPS” (asking the recommend question right after a single interaction) is not the same as classic relationship NPS run quarterly. Transactional NPS trades some strategic value for tighter diagnostic feedback, and you’ll see why that distinction matters in the next section.
How Do NPS and CSAT Compare Across Key Dimensions?
Put side by side, the two metrics diverge almost everywhere except the fact that both start with a customer rating something.
| Dimension | NPS | CSAT |
|---|---|---|
| Question asked | Likelihood to recommend | Satisfaction with a specific interaction |
| Scale & math | 0 to 10; %Promoters − %Detractors | 1 to 5 (or 1 to 10); % giving top scores |
| Time horizon | Relational, long term | Transactional, short term |
| Best use cases | Renewal risk, advocacy identification, board reporting | Support tickets, onboarding steps, feature tests |
| Diagnostic power | Low alone; needs follow-up “why” | High; tied to one clear moment |
| Typical cadence | Quarterly or milestone driven | Immediate, triggered by the interaction |
NPS strengths: simple to benchmark across competitors, correlates with long-term loyalty, and identifies promoters worth turning into advocates. NPS weaknesses: a single number tells you almost nothing about why someone scored you a 6, and it’s a poor fit for judging whether last Tuesday’s support call went well.

CSAT strengths: immediate, specific, and easy to route to the person or team responsible for that moment. CSAT weaknesses: it says nothing about whether a satisfied customer will actually stick around or recommend you. VWO’s comparison of the two metrics makes the same point: CSAT gives you the operational pulse; NPS gives you the strategic trend line. Treat them as different instruments on the same dashboard, not competitors for the same job.
When Should You Use CSAT vs NPS in Practice?
Match the metric to the touchpoint, not to whichever survey template is easiest to send. CSAT belongs at moments with a clear beginning and end:
- Support ticket resolution, sent within minutes or hours of the case closing.
- Post-purchase confirmation, sent within a day of delivery or activation.
- Onboarding completion, sent right after a customer finishes setup.
- Feature or beta test feedback, sent immediately after use.
NPS belongs where you’re measuring the relationship as a whole:
- Quarterly or biannual relationship surveys sent to your full active customer base.
- Renewal-adjacent surveys, timed a few weeks before a contract decision (not the day of, when responses skew defensive).
- Post-onboarding “graduation” surveys, once a customer has had enough time to form a real opinion.
The biggest mistake CX teams make is cramming both questions into every single survey. That produces fatigue and mediocre response rates on both fronts. A cleaner pattern: run CSAT continuously at transactional triggers, and run NPS as a separate, less frequent pulse. If you do run transactional NPS (asking “would you recommend us” right after a support case), treat it as a proxy for that agent’s performance, not as a substitute for your relationship NPS trend. They measure different things even when the question wording looks identical.
Pro Tip: If your NPS and CSAT numbers move in opposite directions for the same account, that’s not noise. It usually means a customer is satisfied with individual interactions but losing confidence in the relationship overall, which is exactly the kind of account renewal risk to flag early.
What Survey Design Actually Gets Usable Answers?
Question wording decides whether your data is useful or just decorative. For CSAT, pair the rating with an immediate follow-up: “What’s the main reason for your rating?” as an open text field. For NPS, always follow the 0 to 10 question with “What’s the primary reason for your score?” Passives and detractors give you your most valuable root-cause data, but only if you ask.
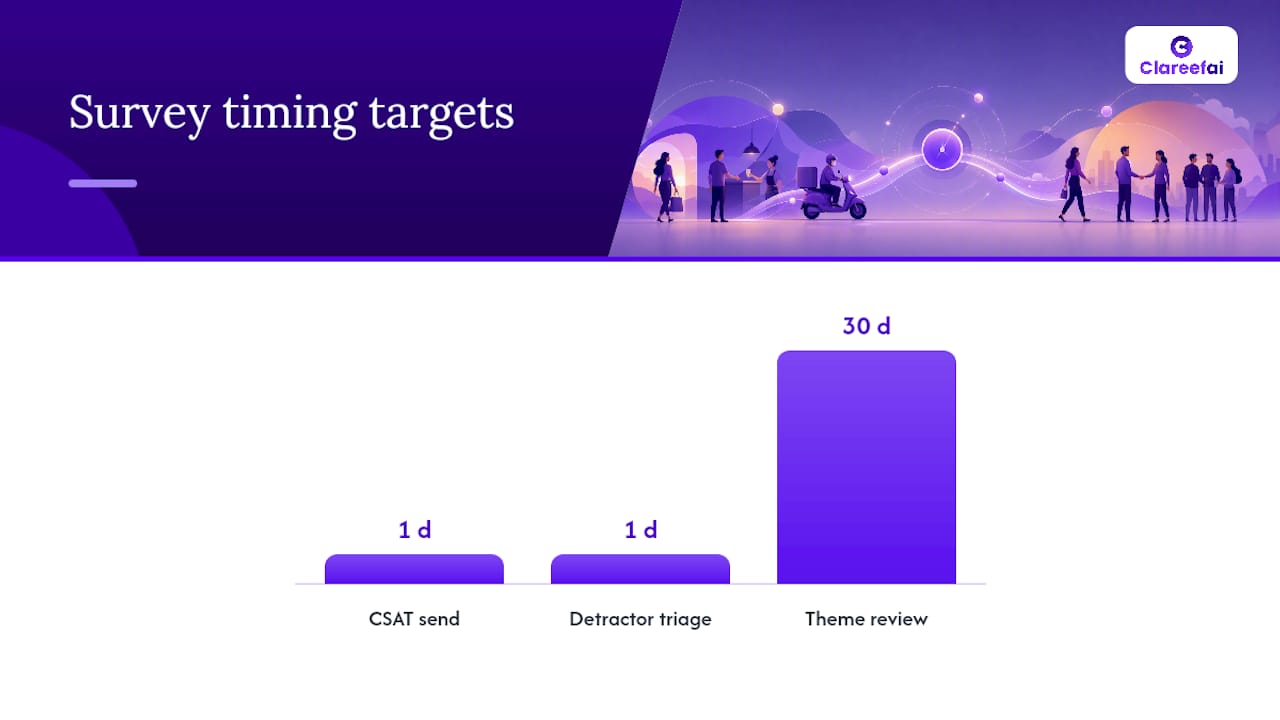
- Trigger CSAT surveys immediately after the interaction, ideally within 24 hours, while the memory is still fresh and specific.
- Time NPS surveys to avoid emotional extremes, meaning don’t send it the day a renewal invoice lands or the week after a major outage.
- Segment your sampling so you’re not only hearing from your loudest power users or your angriest churned accounts. Recency bias and sample bias both distort scores if you survey the same enthusiastic 20% every quarter.
- Close the loop on every low score: triage by severity, route to the owning team (support, product, account management), and log the fix.
- Mine verbatim responses for root-cause patterns rather than treating each comment as a one-off complaint.
Pro Tip: Build a simple triage rule: any detractor score paired with a specific, fixable complaint goes to a human within 24 hours. Vague low scores with no comment go into a monthly theme review instead. That split alone prevents your CX team from drowning in low-value follow-up.
Reducing the effort a customer has to expend often does more for loyalty than trying to delight them, according to Gartner’s research on customer effort and loyalty. That’s a strong argument for pairing CSAT with a customer effort score on your highest-friction touchpoints.
How Do You Interpret Scores and Set Realistic Benchmarks?
A “good” NPS or CSAT score depends heavily on your industry, region, and how you sampled respondents, so treat any universal benchmark with suspicion. A SaaS company and a telecom provider operate under wildly different customer expectations, and comparing your NPS directly against a competitor in another category tells you very little.
- Watch the trend line over multiple quarters rather than fixating on a single snapshot. A steady climb from +20 to +35 matters more than any one reading.
- Cross-reference scores with hard business signals: renewal rate, expansion revenue, and net retention tell you whether the sentiment is translating into dollars.
- Watch for cultural response bias. Some regions rate more generously on 0 to 10 scales as a matter of norm, which can make cross-region comparisons misleading if you don’t segment them.
- Separate your transactional CSAT sample from your relational NPS sample. Blending them hides which population is actually driving a shift.
Churn benchmarks vary substantially by sector. Statista’s industry churn data shows retail and subscription services experiencing very different baseline churn than B2B software, which is exactly why a “great” CSAT in one industry might be mediocre in another.
How One Company Turned Feedback Into Referrals
Pulse Yoga Paris used verified customer testimonials to cut no-show rates and lift class sign-ups, turning satisfied member feedback into a visible trust signal on its booking pages rather than letting it sit unused in a survey export.
That pattern applies directly to NPS and CSAT programs. A promoter identified through your NPS survey (someone scoring 9 or 10) is exactly the customer worth asking for a testimonial, a referral, or a reference call. A high CSAT score after a successful onboarding is the natural trigger to invite that customer into a video testimonial request.
- Route NPS promoters automatically into a testimonial or referral request workflow instead of letting the score sit in a dashboard.
- Route CSAT-flagged detractors to account teams for recovery before the relationship shows up as an NPS problem next quarter.
- Verify and contextualize the resulting testimonials so prospects see a real name and a real outcome, not an anonymous five-star blurb.
The gap between “we have a happy customer” and “we have a customer actively selling for us” is usually just a missing workflow, not a missing customer.
If you want to see how account teams operationalize this handoff from feedback to advocacy, Clareefai’s guide on building trust through testimonials walks through the mechanics.
Turn Your CX Scores Into Sales Assets
Collecting NPS and CSAT data is only half the job. The other half is making sure your best scores don’t stay buried in a survey tool where prospects never see them. Clareefai’s platform for customer advocacy identifies your NPS promoters automatically, routes them into verified testimonial requests, and publishes the strongest stories across the channels your sales team actually uses.
If you’re building the business case for a formal Voice of Customer program, the management-focused solution page breaks down how to measure advocacy ROI alongside your existing CSAT and NPS reporting. Customer success teams closing the loop on detractor recovery can see the same workflow from their side on the customer success solution page. And if retention tactics beyond survey design are on your roadmap, Babylovegrowth’s retention strategy guide covers practical tactics that pair well with a strong VoC program.
What the Data Actually Tells Us About This Debate
The “NPS vs CSAT” framing itself is a little misleading, and it’s worth saying plainly: this was never a real contest. Most of the debate online treats it like a bracket where one metric should win, when the actual research points toward a simpler truth. Teams that argue hardest for a single “best” metric usually haven’t mapped their metrics to their actual decisions yet.
Where conventional advice falls short is in treating NPS as a diagnostic tool. It isn’t one. A promoter score tells you almost nothing actionable without the follow-up “why,” and teams that skip that question end up with a number they can report but can’t act on.
What deserves more attention than it gets: the handoff between measurement and advocacy. Most CX teams stop at the dashboard. The real leverage sits in what happens after you identify a promoter, whether that customer ever becomes a testimonial, a reference, or a closed deal. Prioritize building that pipeline before you spend more time debating survey mechanics.
Sources
- CSAT vs NPS: Which Customer Satisfaction Metric Is Best? — Qualtrics
- CSAT vs NPS: A Quick Guide to Choose Wisely — VWO
- Gartner press release on customer effort and loyalty
- Customer churn rate by industry in the United States — Statista
Recommended
- Slash Customer Effort by 50%: Master CES for Explosive SaaS Growth | ClareefAI Blog
- Net Retention Rate: The Metric Every SaaS Leader Should Obsess Over - ClareefAI Blog
- CSM Targets: Building a Promoter Powerhouse | Customer Success KPIs & Advocacy Goals - ClareefAI Blog
- For Management - Clareefai | Measure Customer Advocacy ROI
Share Article
Stay Updated
Get the latest insights on customer advocacy and SaaS growth delivered to your inbox.