NPS Promoters vs. Detractors: What CX Teams Should Do
Promoters score 9 or 10 on the “would you recommend us” question. Detractors score 0 through 6. Passives sit at 7 or 8 and get excluded from the math entirely. Your Net Promoter Score is the percentage of promoters minus the percentage of detractors, a number indicating overall customer sentiment.
Your first move after pulling a fresh NPS report: triage detractors by severity and close the loop with the harshest ones before you do anything else, then turn to promoters and get their advocacy moving.
- Promoters (9–10): loyal customers likely to refer, renew, and expand
- Passives (7–8): satisfied but unenthusiastic, excluded from the score
- Detractors (0–6): at churn risk and vocal about dissatisfaction
- Priority action: diagnose and respond to high-severity detractors first; activate promoters second
Key Takeaways
NPS turns into a growth lever only when detractors get a fast, severity-matched response and promoters get an equally fast path to advocacy.
| Point | Details |
|---|---|
| Know the score bands | Promoters score 9–10, passives 7–8, detractors 0–6; NPS equals % promoters minus % detractors. |
| Prioritize by severity | Bucket detractors into 0–2, 3–4, and 5–6 to route the right response speed and owner. |
| Close the loop fast | Respond to detractors within 48 hours, the window linked to stronger recovery outcomes. |
| Pair the score with verbatim data | Always ask “Why?” and tag responses to find root causes NPS alone can’t reveal. |
| Activate promoters, don’t just log them | Clareefai verifies promoter identities and automates testimonial requests, turning high scores into referrals and sales assets. |
Table of Contents
- NPS Promoters vs. Detractors: Definitions and How to Calculate the Score
- Why Promoters and Detractors Matter for Growth and Churn
- How to Identify and Analyze Promoters and Detractors
- Turning Detractors Into Promoters: A Priority Playbook
- How to Turn Promoters Into Referrals and Testimonials
- Where NPS Falls Short and How to Keep It Useful
- A Four-Stage Framework for Diagnostic NPS
- Sample Follow-Up Questions and Scripts by Segment
- What Most CX Teams Get Wrong About Promoter Activation
- Put Promoter Activation on Autopilot
- Sources
NPS Promoters vs. Detractors: Definitions and How to Calculate the Score
The score bands aren’t arbitrary. Bain & Company, which created the metric, drew the promoter cutoff at 9–10 because those respondents show up in follow-up research as consistently more likely to repurchase and refer others, while 0–6 correlates with elevated churn risk, according to the Net Promoter Score standard. Passives get excluded from the formula because their behavior is genuinely mixed. They won’t hurt you, but they won’t champion you either.
Two equivalent ways to calculate it:
- Percentage method: (Number of promoters ÷ total respondents) − (Number of detractors ÷ total respondents), multiplied by 100
- Direct subtraction: % Promoters − % Detractors
Say you survey 200 customers: 110 score 9–10 (55% promoters), 50 score 7–8 (passives, excluded), and 40 score 0–6 (20% detractors). Your NPS is 55 minus 20, or +35.
Statistic: NPS ranges from −100 to +100, always reported as a whole integer, never a percentage. A score built on 20 responses swings wildly with a single change of mind, so treat small-sample NPS as directional, not definitive, and confirm findings against your industry’s scoring standard.
Why Promoters and Detractors Matter for Growth and Churn
NPS segments aren’t a vanity metric when you connect them to revenue. Promoters refer at meaningfully higher rates and tend to carry higher lifetime value because they stick around and expand their spend. Detractors do the opposite: they’re your highest churn-risk segment, and their complaints spread faster than praise ever does.
- Promoters fuel word-of-mouth pipeline that costs nothing to acquire
- Detractors predict churn well before a cancellation request hits your desk
- The gap between the two groups tells you more than the raw score alone
- Benchmarks vary enormously by industry, so compare your NPS to your own history and sector peers, not a universal target
Statistic: NPS predicts loyalty at a high level, but on its own it lacks diagnostic detail. It works best paired with open-ended follow-ups and driver analysis, according to Salesforce’s guide to the metric. That’s the whole case for treating NPS as a starting point, not a scoreboard. If you’re already tracking net retention rate, NPS segments give you an early warning system for where that number is headed next quarter.
How to Identify and Analyze Promoters and Detractors
The score alone tells you nothing about why. That’s where most NPS programs quietly fail. You get a number, you report it upward, and nobody actually knows what to fix.
Start with where and when you field the survey. Transactional NPS, sent right after a support ticket closes or an onboarding milestone, catches specific friction points. Relationship NPS, sent quarterly or annually, measures the overall health of the account. In-app prompts capture behavior in the moment but risk lower response rates if timed poorly. Run all three where your customer touchpoints justify it, and watch your response rate. A 15% response rate from a small account base tells you far less than the same rate from thousands of respondents.
- Always pair the score with “Why did you give us this rating?” This single open-ended question is where the real diagnostic value lives, according to Qualtrics’s research.
- Tag verbatim responses by theme (pricing, support, product gaps, onboarding) so patterns emerge across dozens or hundreds of comments.
- Use keyword-driver or causal segmentation (decision trees, cohort comparisons) to isolate which specific factors move the score for specific customer groups.
- Bucket detractors by severity: 0–2 (actively hostile, likely to churn or complain publicly), 3–4 (frustrated but engaged), 5–6 (mildly dissatisfied, often recoverable with a quick fix).
Pro Tip: Don’t stop at “what” the tags say. Cross-reference severity buckets against account value. A 0–2 score from your largest account deserves a phone call within the hour, not a place in next week’s ticket queue. For guidance on structuring the open-ended questions themselves, survey design best practices cover the wording choices that actually get honest answers.
Turning Detractors Into Promoters: A Priority Playbook
Speed matters more than most CX teams assume. Closing the loop with detractors within 48 hours is linked to meaningfully better recovery outcomes than waiting a week, based on practitioner research from CustomerGauge. Treat that window as your service-level standard, not a nice-to-have.
- Assign an owner within 24 hours. Route by severity: a 0–2 score goes to a senior CX manager or account owner, not a junior support rep.
- Open with a diagnostic question, not an apology script. Try: “I saw your feedback, and I want to understand exactly where we let you down. Can you walk me through what happened?”
- Route the fix correctly. A technical bug goes to product/engineering. A service failure goes to service recovery (refund, credit, replacement). A policy complaint goes to leadership for a real decision, not a canned response.
- Re-survey after resolution, ideally within 30 days, to measure whether the score moved.
- For 5–6 scores, a quick acknowledgment plus one concrete fix often resolves the issue
- For 3–4 scores, expect a longer conversation and possibly an escalation
- For 0–2 scores, involve a decision-maker who can authorize real remediation, not just apologize
- Track recovery rate (percentage of detractors who re-score as passive or promoter) as your core success metric
How to Turn Promoters Into Referrals and Testimonials
Promoters are your cheapest, most credible growth channel, and most companies let that value evaporate by never asking. Time the ask close to the moment of delight, right after a positive score or a successful renewal, when enthusiasm is highest and friction is lowest.
- Ask a specific, low-effort question: “Would you be open to a two-minute video testimonial about your experience?” beats a generic “Leave us a review.”
- Offer a verified reference program instead of an anonymous review request. Named, contextualized proof converts better with prospects than star ratings alone.
- Track referral conversion rate and pipeline influenced by promoter-sourced content as your core KPIs, not just the number of testimonials collected.
- Give marketing teams direct access to fresh promoter content so it doesn’t sit unused in a spreadsheet. Clareefai’s tools for marketers repurposing advocacy content exist for exactly this handoff.
Where NPS Falls Short and How to Keep It Useful
A single aggregate number hides more than it reveals. Two companies can both post an NPS of +30, one with a cluster of furious 0–2 detractors and one with mostly mild 5–6s, and those are entirely different problems requiring entirely different responses.
- Aggregation flattens severity, so always break detractors into buckets rather than treating the group as uniform
- Sampling bias skews results when only highly satisfied or highly frustrated customers bother to respond
- Incentivizing responses (discounts for completing the survey) distorts the distribution and inflates scores artificially
- Cultural response tendencies vary by region, which complicates cross-market benchmarking
NPS alone can be biased by sample selection and aggregation. Organizations should segment by cohort and analyze severity within the detractor group rather than treating it as one uniform block, a distinction Dynata’s research on the metric makes clear.
Pair NPS with CSAT, churn, and retention data before making resourcing decisions. A broader customer success metrics framework prevents any single score from carrying more weight than it can bear, a point TechTarget’s guide reinforces as well.
A Four-Stage Framework for Diagnostic NPS
Most teams stop at measurement. A more rigorous approach moves through four stages, outlined in a recent analytical framework for diagnostic NPS:
- Observe: track the score and segment distribution over time using control charts to separate real movement from noise.
- Explore: mine open-text responses and use causal segmentation, such as decision trees, to identify which drivers matter for which cohorts.
- Confirm: test whether a fix actually moved the score for the affected cohort before rolling it out company-wide.
- Institutionalize: bake the validated fix into standard process, not a one-time save.
Pro Tip: Skip the “confirm” stage and you’re guessing. A fix that looks like it worked might just be regression to the mean. This approach needs a reasonable sample size per cohort, so smaller B2B customer bases may need to pool quarters before drawing firm conclusions.
Sample Follow-Up Questions and Scripts by Segment
The question you ask after the score determines whether you get actionable data or a shrug. Match your script to the segment.
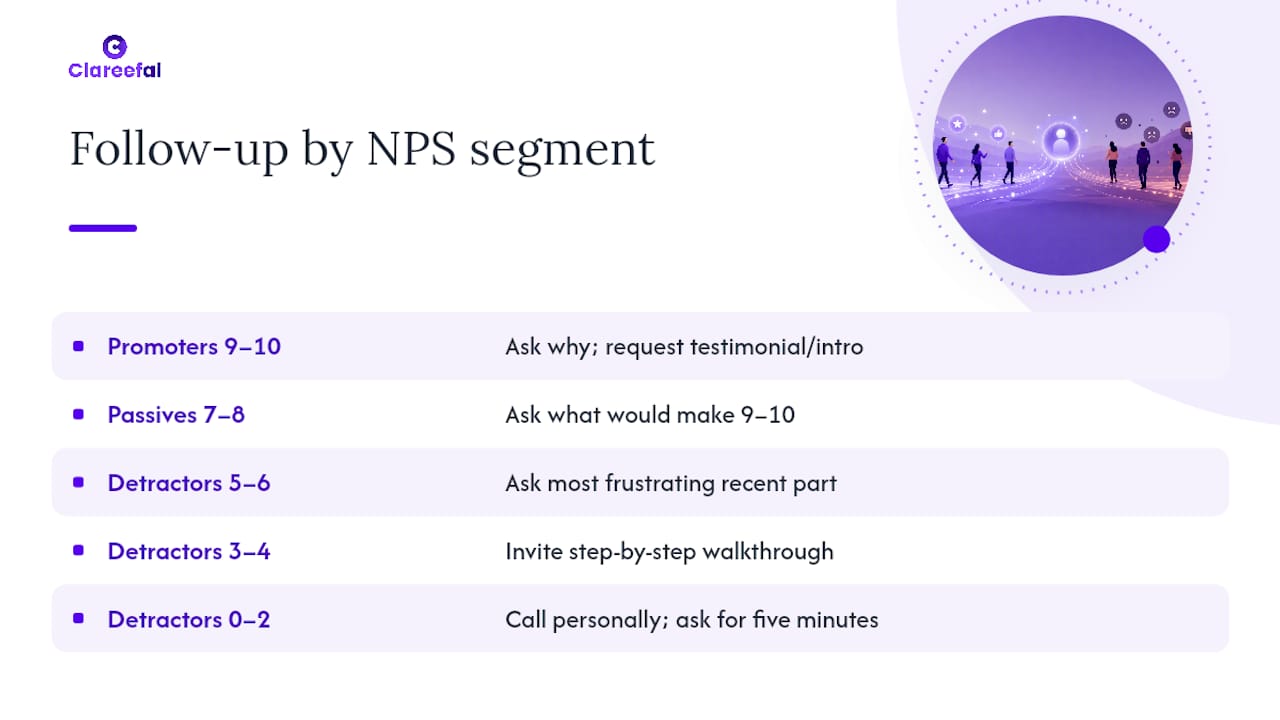
For promoters (9–10): “What’s the single biggest reason you’d recommend us?” followed by “Would you be willing to share that in a short testimonial or introduce us to someone who might benefit?” Keep it conversational, not transactional. Promoters respond better to a genuine thank-you than a form request.

For passives (7–8): “What would it take to make this a 9 or 10 for you?” This question is underused, and it’s often the most revealing one on the survey. Passives frequently name one specific, fixable gap rather than a vague complaint.
For detractors, severity 5–6: “What was the most frustrating part of your recent experience?” Keep it specific and time-bound to their most recent interaction.
For detractors, severity 3–4: “It sounds like we fell short. Can you walk me through what happened, step by step?” This invites detail without sounding defensive.
For detractors, severity 0–2: Skip the survey follow-up entirely and call. “I want to personally understand what went wrong and fix it. Do you have five minutes?” A phone call signals urgency that an email never will, especially for high-value accounts at risk of public complaints or cancellation.
What Most CX Teams Get Wrong About Promoter Activation
Most NPS programs pour resources into detractor recovery and treat promoters as a footnote, a “nice score, move on” line item. That’s backward. Detractor recovery limits downside; promoter activation builds upside, and upside is what actually shows up in your growth numbers.
Clareefai exists because verified advocacy from real promoters closes the trust gap that anonymous reviews and generic testimonials can’t. When a promoter’s identity and story get verified and matched to the right prospect moment, that signal compounds far beyond a single survey response. Pairing NPS recovery work with structured promoter activation is what separates a measurement exercise from an actual growth lever.
— ClareefAi
Put Promoter Activation on Autopilot
You’ve triaged your detractors and built a follow-up SLA. Now what happens to your promoters? For most teams, the answer is “nothing,” because manually chasing down testimonials, verifying identities, and matching the right advocate to the right prospect takes more hours than any CX team has to spare.
Clareefai automates that entire workflow. It identifies your strongest promoters through AI-driven analysis, requests testimonials and video reviews at the right moment, verifies customer identities so prospects trust what they’re reading, and publishes the results across the channels your sales and marketing teams already use. Instead of a promoter’s 9 or 10 score sitting in a spreadsheet, it becomes a verified case study working your pipeline. If you want to see how this plays out for accounts with real pipeline stakes, this unified testimonial management use case shows the mechanics. Explore the Clareefai platform and start a trial to get your first verified testimonials collected this week.
Sources
Recommended
- CSM Targets: Building a Promoter Powerhouse | Customer Success KPIs & Advocacy Goals - ClareefAI Blog
- Solutions - Clareefai | Customer Advocacy for Sales, Marketing & Management
- For Customer Success - Clareefai | Turn Happy Accounts into Advocates
- For Management - Clareefai | Measure Customer Advocacy ROI
Share Article
Stay Updated
Get the latest insights on customer advocacy and SaaS growth delivered to your inbox.